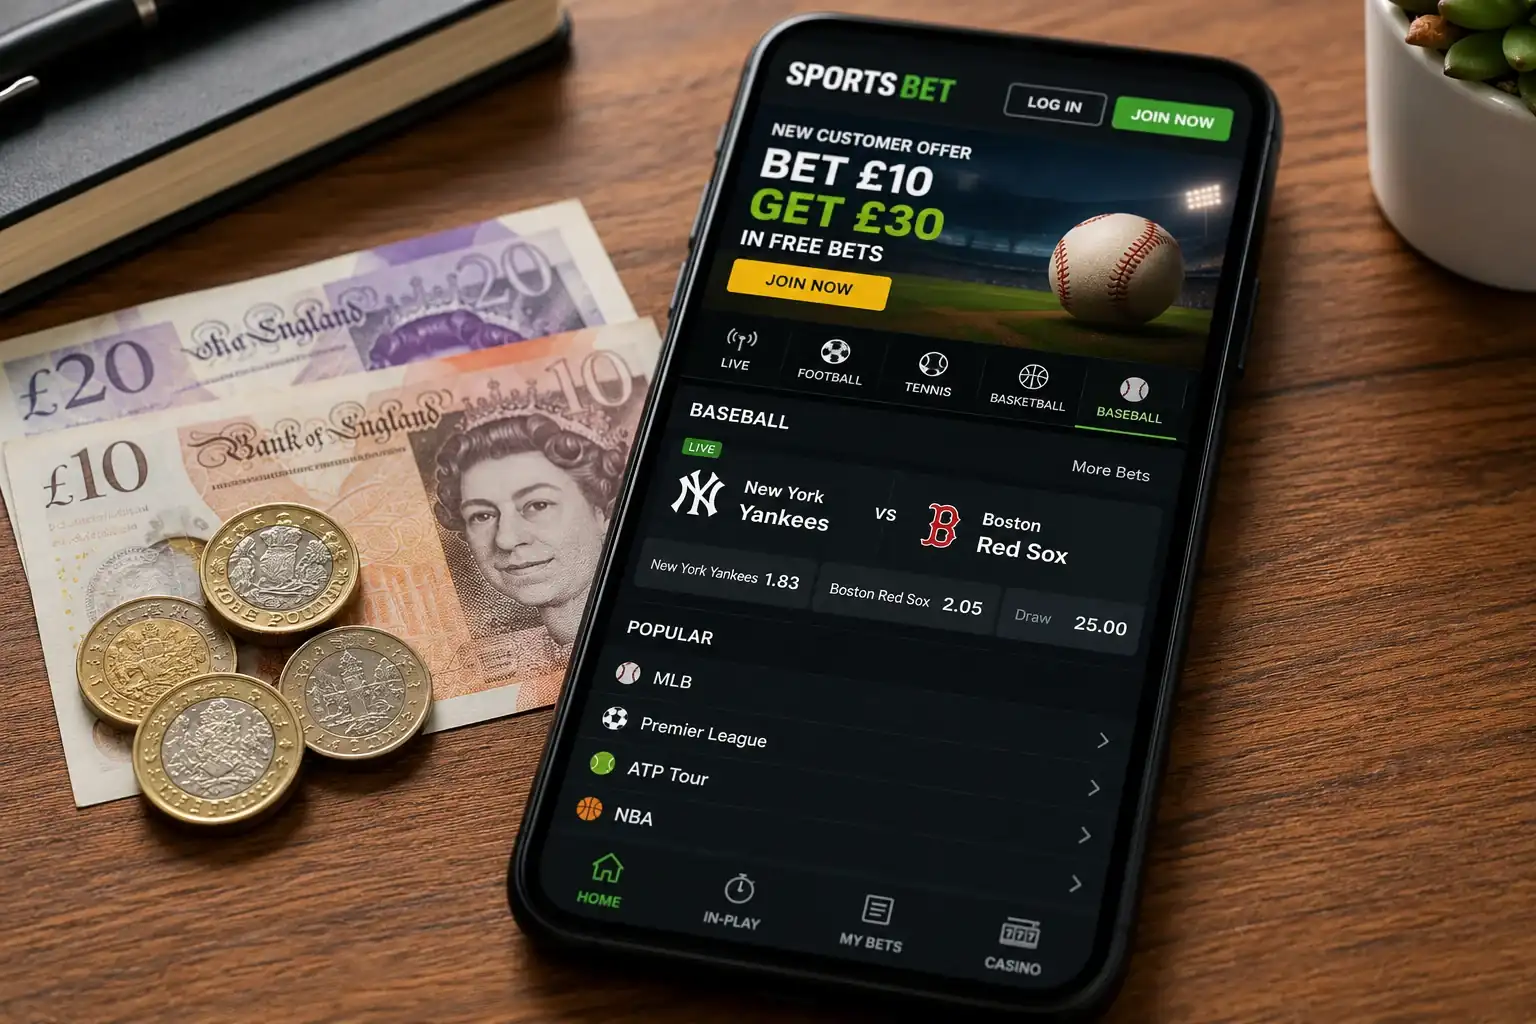
MLB Betting Implied Probability: Calculating Market Value
 Available in US

The moment that changed how I bet baseball was not a winning streak or a clever system — it was a five-minute conversation about percentages. A sharper bettor I respected asked me a simple question: “What probability does that price imply, and do you think the real probability is higher?” I could not answer. I had been placing bets based on whether the odds “looked good” without ever converting them into the language of probability. Once I learned the conversion, every line on every board became a statement I could agree or disagree with, backed by my own assessment. That framework — comparing implied probability to estimated probability — is the foundation of profitable MLB betting.
The average sportsbook hold in the US runs at 10.15%, which means bookmakers retain roughly 10 pence of every pound wagered over time. That hold is embedded in the odds as an overround — the combined implied probability of all outcomes exceeds 100%. Your job as a bettor is to find spots where the actual probability of an outcome exceeds its implied probability by enough to overcome that margin. Implied probability is the tool that makes that comparison possible.
Applying Implied Probability Formulas to MLB Odds
I spent years betting in decimal odds without ever doing this calculation, and looking back, that is embarrassing. The formula for decimal odds is the simplest piece of arithmetic in all of sports betting: implied probability = 1 / decimal odds. That is it. A team priced at 2.00 in decimal carries an implied probability of 1 / 2.00 = 0.50, or 50%. A team at 1.60 carries 1 / 1.60 = 0.625, or 62.5%. A team at 3.40 carries 1 / 3.40 = 0.294, or 29.4%.
For American odds, the calculation depends on whether the number is positive or negative. Positive odds (+150): implied probability = 100 / (odds + 100) = 100 / 250 = 40%. Negative odds (-180): implied probability = |odds| / (|odds| + 100) = 180 / 280 = 64.3%. You will encounter American odds on US-facing data sites and in some analytical tools, so knowing the conversion is useful even if your bookmaker displays everything in decimal.
Fractional odds — 6/4, 5/2, 4/1 — are less common for MLB in the UK but still appear at some operators. The formula: implied probability = denominator / (numerator + denominator). For 6/4: 4 / (6 + 4) = 0.40, or 40%. For 5/2: 2 / (5 + 2) = 0.286, or 28.6%. I keep a small conversion table bookmarked for fractional odds, but in practice, decimal is the format I work in for all MLB analysis.
The critical habit is to convert every line you consider into a percentage before deciding whether to bet. “2.10 on the underdog” means nothing until you translate it to “the bookmaker believes this team wins 47.6% of the time.” Now you have a claim you can evaluate against your own research. Do you think this team wins more than 47.6% tonight? If yes, you have a potential bet. If no, move on.
Breakeven Win Rate: How Often You Need to Win
Implied probability tells you what the bookmaker thinks. Breakeven win rate tells you what you need. They are related but not identical, and confusing them is one of the most common analytical errors in baseball betting.
Breakeven win rate is the minimum percentage of bets you must win at a given odds level to avoid losing money over time. For decimal odds, it is the same as implied probability: at 2.00, you need to win 50% of the time to break even. At 1.80, you need 55.6%. At 2.50, you need 40%. These thresholds assume flat staking — the same amount on every bet — and they do not account for commission or other friction.
Where the concept becomes actionable is in mapping breakeven rates to your historical results. If you have been betting MLB moneyline underdogs at an average price of 2.20, your breakeven win rate is 45.5%. Pull up your records. Are you winning 48% of those bets? Then you are profitable. 43%? You are losing, and you need to either improve your selection process or move to a different odds range. The gap between your actual win rate and the breakeven win rate is your edge — or your leak. Understanding that gap, in precise percentage terms, is what makes the difference between a bettor who thinks they are doing well and one who knows.
For MLB odds analysis, I maintain a running log of my bets with columns for odds, implied probability, and result. At the end of each month, I calculate my actual win rate by odds band — 1.50 to 1.80, 1.80 to 2.20, 2.20 to 3.00, and so on — and compare it to the breakeven rate for each band. That comparison tells me where my edge lives and where it does not, with no guesswork involved.
Spotting Value: When Your Estimate Beats the Market
Value betting is the only long-term profitable strategy in sports wagering. Everything else — hunches, narratives, hot streaks — is noise dressed in conviction. Value exists when the true probability of an outcome is higher than the implied probability embedded in the odds. Finding it requires two things: an accurate implied probability calculation (which you now have) and an independent estimate of the true probability (which takes work).
My process for estimating true probability on an MLB game begins with the starting pitching matchup. I model each starter’s expected performance using xFIP and recent form, then estimate a win probability based on the matchup. I adjust for park factor, weather, and bullpen availability. The output is a rough percentage — say, 55% for the home team. If the bookmaker’s implied probability for the home team is 52%, the gap is 3 percentage points. That is a bet worth making.
Exchange betting data suggests that peer-to-peer wagering offers roughly a 40% chance of profitability compared to about 2% at traditional bookmakers, largely because exchanges operate with tighter margins that erode less of the bettor’s edge. The implication for implied probability analysis is clear: the platform you bet on affects how much value you need to find. At a bookmaker with a 6% overround on MLB, you need to beat the market by at least 3% per side to break even. At an exchange with a 2% commission, the threshold is lower, and marginal value plays become profitable.
The discipline is in the selectivity. I do not bet every game where I find a 1% edge. Transaction costs, variance, and model uncertainty mean that thin edges get eaten alive over short samples. I look for gaps of 3% or more between my estimated probability and the implied probability, and I concentrate my volume in those spots. Over a 162-game season with 10-15 games per night, there are usually two or three clear value plays each day. That is enough to build a profitable season without forcing action on games where the edge is imaginary.
When the Numbers Say No
The hardest part of implied probability analysis is accepting the answer when it goes against your instinct. You have watched a team win six straight. You like their pitcher. The crowd is loud, the lineup is raking, and every narrative fibre in your brain says “back them.” Then you run the numbers: the bookmaker’s price implies 64% probability, and your model says 62%. The market is right, or at least close enough that no edge exists. The correct action is no action.
I pass on more games than I bet. Most nights, between a third and half of my initial shortlist gets eliminated during the implied probability check. The bets that survive are the ones where the gap between market and model is wide enough to justify the risk. That selectivity is not conservative — it is strategic. The 162-game season provides 2,430 games’ worth of opportunity, and the bettor who extracts value from 400 well-chosen plays will outperform the one who spreads 1,000 bets across every game that catches their eye.
Implied probability is not a magic formula. It is a lens that turns odds into claims and lets you evaluate those claims with the same rigour you would apply to any other investment. The bookmaker says this team has a 58% chance. You say 63%. That five-point difference is your edge, and implied probability is how you found it. The rest — the research, the discipline, the bankroll management — is execution. But without the lens, you are executing blind.
What does a 55% implied probability mean for an MLB bet?
It means the bookmaker’s odds suggest the outcome will occur 55% of the time. In decimal odds, a 55% implied probability corresponds to a price of approximately 1.82. If your own analysis estimates the true probability at 60% or higher, the bet offers positive expected value. If your estimate is at or below 55%, the bookmaker has priced the market correctly and no edge exists.
How do I know if an MLB bet has positive expected value?
Convert the decimal odds to implied probability using the formula 1 / odds. Then compare that percentage to your own estimated probability for the outcome. If your estimate is higher than the implied probability, the bet has positive expected value. The larger the gap, the stronger the value. A gap of 3% or more after accounting for the bookmaker’s margin is generally the threshold for a worthwhile play.
Created by the ”” editorial team.