MLB Betting Odds: Reading Decimal and American Payouts
Table of Contents
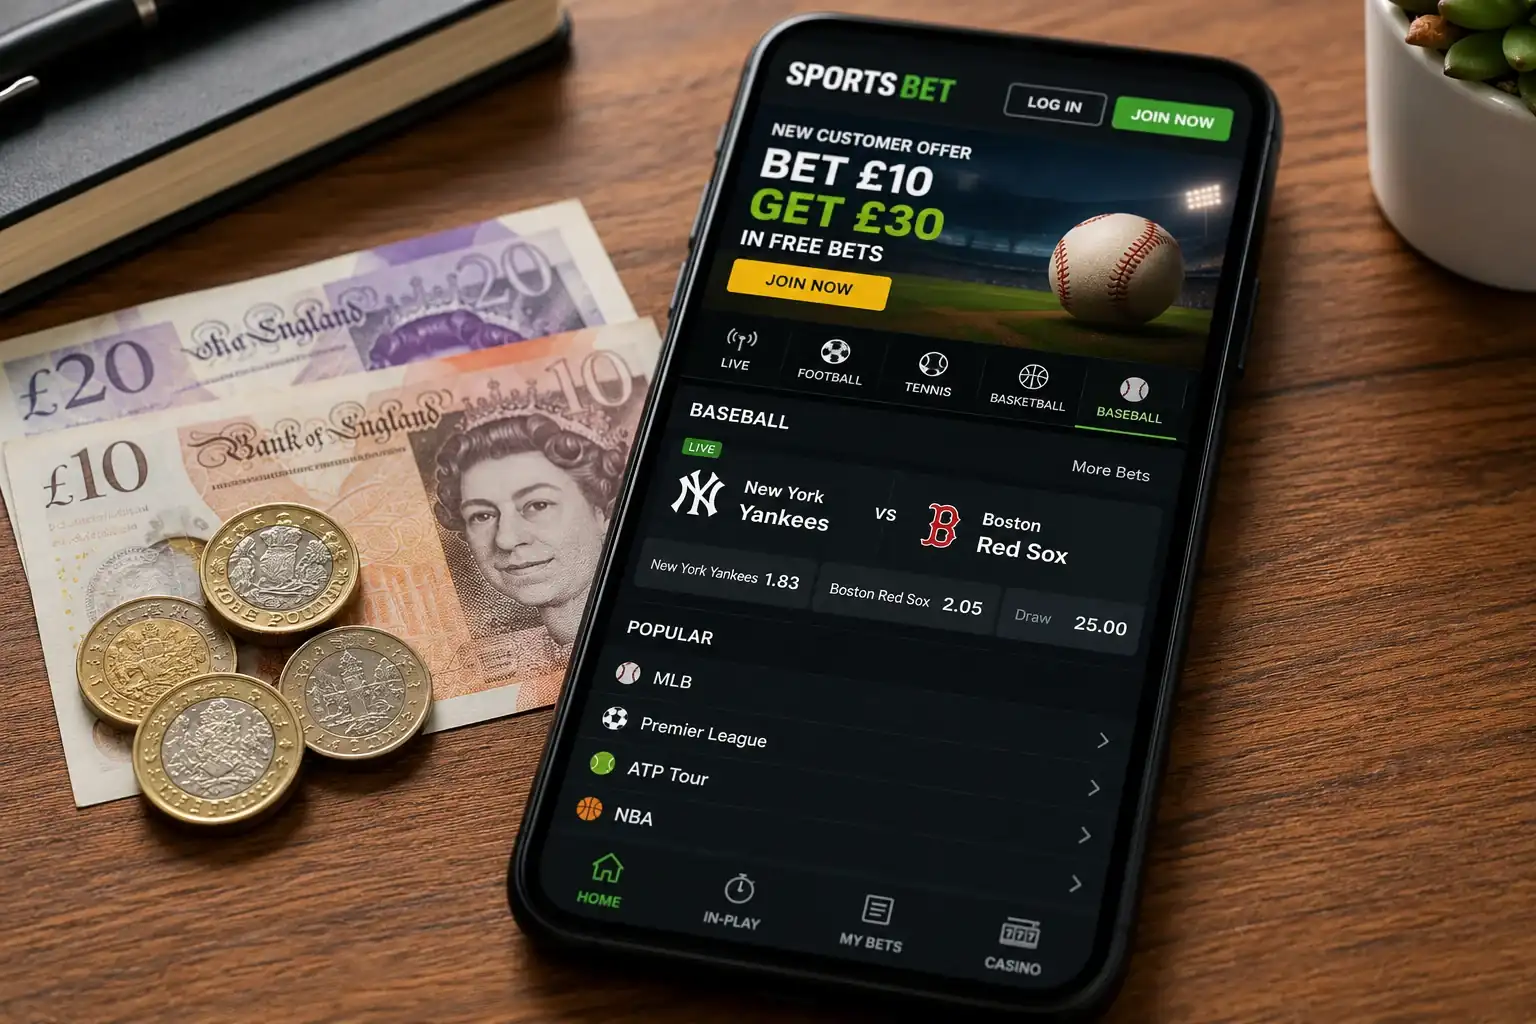
The odds on a baseball game tell you more than just the potential payout. They encode the bookmaker’s assessment of each team’s probability of winning, bake in a profit margin, and shift in real time as money and information enter the market. Understanding what those numbers actually mean — and which format gives you the clearest read — is the difference between betting with your eyes open and betting in the dark.
I wasted most of my first season ignoring the maths. I would look at two decimal prices, pick the one that «felt right,» and move on. It was not until I started converting odds into implied probabilities that I realised how often I was backing teams at prices that required a win rate I could never sustain. The American sports betting market processed $149.6 billion in legal handle during 2024 alone, a 23.5% increase on the prior year — and every dollar of that volume was shaped by odds. If you are placing bets from the UK on MLB games, the odds formats you encounter will vary depending on which bookmaker you use. Here is how to read all three, convert between them, and extract genuine value from the numbers.
Once you understand how to calculate implied probability, applying this knowledge to MLB moneyline betting becomes much more intuitive and profitable.
Calculating Returns with Decimal MLB Odds
Every UK-licensed bookmaker defaults to decimal odds, and for good reason: the format is mathematically the most transparent of the three. The decimal number represents the total return per pound staked, including your original stake. Multiply the decimal by your stake and you have your full payout.
Suppose the Houston Astros are listed at 1.75 against the Seattle Mariners at 2.20. A 10-pound bet on the Astros returns 17.50 if they win — 10 pounds of that is your original stake, and 7.50 is profit. The same 10 pounds on the Mariners returns 22 pounds, with 12 pounds in profit. The lower the decimal number, the shorter the price and the more the bookmaker expects that team to win.
What makes decimal odds particularly useful for MLB is how cleanly they reveal the implied probability. The formula is simple: divide 1 by the decimal odds. For the Astros at 1.75, that gives you 1 / 1.75 = 0.571, or 57.1%. For the Mariners at 2.20, it is 1 / 2.20 = 0.454, or 45.4%. Add those together and you get 102.5% — the extra 2.5% above 100 is the bookmaker’s overround, their built-in profit margin.
I work exclusively in decimals when analysing MLB lines. The format eliminates the mental gymnastics of American odds and gives me a direct line from price to probability. If you are coming from football betting in the UK, you are already fluent in this format — the only adjustment is calibrating your sense of what constitutes a «short» or «long» price in baseball. A 1.50 favourite in MLB is quite heavy; a 2.50 underdog is not remotely outlandish. The sport’s competitive balance compresses the odds range compared to football.
One detail worth noting: some UK bookmakers display MLB decimal odds to two decimal places (1.75), while others use three (1.752). The third decimal place matters over large volumes. If you are placing 200 bets across a season at an average stake of 20 pounds, the difference between 1.75 and 1.752 across those bets is roughly 80 pence in cumulative return — trivial in isolation, but illustrative of how small edges compound in a sport with this much wagering volume. Always take the extra decimal precision when it is available.
American Odds: What the Plus and Minus Mean
American odds dominate US sportsbooks and appear frequently in MLB analysis, previews, and social media discussion. If you follow any baseball betting content from the States, you need to read them fluently — even if you never place a bet using this format.
The system works on a baseline of 100. A minus figure tells you how much you must stake to win 100 units. A plus figure tells you how much you win from a 100-unit stake. So a favourite listed at -150 requires a 150-unit wager to return 100 units of profit (plus the original 150 back). An underdog at +180 returns 180 units of profit from a 100-unit stake.
The disconnect for UK bettors is that American odds are designed around an even-money anchor that does not exist in decimal format. At -110 on both sides, you need to win 52.4% of the time to break even — that is the standard juice on a balanced market. The further the line stretches from -110, the more one side is favoured. A -200 favourite needs to win two out of three times for flat staking to break even; a +200 underdog only needs to win one in three.
I find American odds useful for one specific purpose: quickly gauging the size of the perceived gap between two teams. When I see -170 / +150, I know the favourite is meaningful but not overwhelming. When I see -260 / +210, I know the market sees a substantial mismatch. For actual calculations, I convert to decimal immediately.
One quirk that trips up UK bettors encountering American odds for the first time: the two sides of the market are not symmetrical. A favourite at -170 does not correspond to an underdog at +170. The underdog in that market might be +145 or +150. The gap between the absolute values of the two lines is the bookmaker’s margin. The wider the gap, the more the house is taking. In decimal terms, those same odds would be approximately 1.59 and 2.50, and the overround becomes visible instantly.
Fractional Odds: The Traditional UK Format
Fractional odds are a relic of horseracing culture, and some UK bookmakers still offer them as an option. A price of 3/2 means you win three units for every two units staked. A price of 4/5 means you win four units for every five staked — in other words, the team is the favourite and you are getting back less profit than your outlay.
For MLB, fractional odds are awkward. Baseball prices rarely land on clean fractions, so you end up with lines like 17/20 or 11/8 that require mental arithmetic most people would rather skip. The format also obscures the implied probability, because you need to calculate it as denominator / (denominator + numerator) rather than the single division step that decimal offers.
My advice: switch your bookmaker’s display to decimal and do not look back. Fractional odds add nothing to your MLB betting analysis and subtract clarity at every step. If you encounter them in older content or on a niche UK operator, convert to decimal using the formula: (numerator / denominator) + 1. So 3/2 becomes (3/2) + 1 = 2.50 decimal.
Converting Between All Three Formats
Once you have the decimal price, everything else falls out with basic arithmetic. That is why I recommend learning the decimal-to-other conversions rather than memorising a table.
Decimal to American: if the decimal is 2.00 or above (underdog or even money), the formula is (decimal – 1) x 100. So 2.40 decimal becomes (2.40 – 1) x 100 = +140. If the decimal is below 2.00 (favourite), the formula is -100 / (decimal – 1). So 1.65 becomes -100 / 0.65 = -153.8, typically rounded to -154.
Decimal to fractional: subtract 1 from the decimal and express the result as a fraction. 2.50 becomes 3/2. 1.80 becomes 4/5. The messier decimals — 2.15, 1.72 — produce fractions like 23/20 or 18/25, which is precisely why nobody uses fractional odds for baseball.
American to decimal: for a positive American line, divide by 100 and add 1. So +160 becomes 2.60. For a negative American line, divide 100 by the absolute value and add 1. So -140 becomes (100/140) + 1 = 1.714. I keep a simple spreadsheet open during pregame analysis that does these conversions automatically, but the formulas are worth knowing by heart because they surface in almost every piece of baseball betting content produced in the US.
If you are new to MLB wagering and want a deeper walkthrough of how these numbers work alongside bet types, the beginner’s guide to baseball betting covers the practical side in more detail.
Implied Probability and Finding Bookmaker Margin
I spent an embarrassingly long time betting before I understood implied probability. The concept is straightforward: the odds on any selection tell you how often that selection needs to win for the bet to break even at that price. Everything in profitable betting follows from that one idea.
The formula, as I mentioned, is 1 / decimal odds. A team at 1.90 carries an implied probability of 52.6%. A team at 2.10 carries 47.6%. If you believe the actual probability of the first team winning is 55%, and the line prices them as if they win 52.6% of the time, you have found a positive expected value situation. If you believe they win 51% of the time, you have not — the margin eats you.
The bookmaker margin (also called the overround or vigorish) is the sum of implied probabilities on all outcomes minus 100%. On a two-way MLB moneyline, you add the implied probability of both sides. If the total is 104.5%, the bookmaker is holding a 4.5% margin on that market. The average US sportsbook holds about 10.15% across its MLB markets, which is higher than many bettors realise — every 100 pounds wagered across both sides returns roughly 90 pounds to bettors in aggregate.
That margin is not evenly distributed. It tends to be loaded more heavily onto the underdog side, which is why sharp bettors often find better value on underdogs — the price is inflated by margin more than the favourite’s price is. Understanding where the bookmaker hides their edge is the first step toward finding your own.
A quick self-test: before you place any MLB bet, calculate the implied probability from the decimal odds. Then ask yourself — do I genuinely believe this team wins more often than that percentage? If the answer is an honest yes, based on your research into the pitching matchup and situational factors, proceed. If you hesitate, move on to the next game. This single discipline has saved me more money than any strategy I have ever employed.
Here is the maths on a real scenario. You see a moneyline of 2.25 on a home underdog whose starting pitcher has been dominant in his last five outings. The implied probability at 2.25 is 44.4%. You assess the pitcher’s form, the opposing lineup’s recent performance against left-handed starters, and the park factors — and you estimate the home side has a genuine 48% chance of winning. The gap between the bookmaker’s 44.4% and your 48% is your expected edge. Over 100 identical bets at this edge, you would expect to profit roughly 8 units — not life-changing, but consistently positive. The discipline is making sure you only place bets where that gap exists and is not a product of wishful thinking.
Why MLB Odds Move and What It Signals
MLB odds are not static. They open hours before first pitch and shift continuously as money enters the market, new information surfaces, and the bookmaker adjusts their risk exposure. Reading those movements is a skill that takes time to develop, but even a basic awareness changes how you approach your bets.
The most common driver of line movement is the starting pitcher. If the listed starter is scratched and replaced by a lesser arm, the line will shift immediately and often dramatically — a team that was a -150 favourite can become a -120 favourite within minutes. That is why confirming starters before betting is not optional; it is foundational.
Weather announcements can also move lines, particularly on totals. A forecast of strong wind blowing out to centre field at Wrigley Field can push a total from 8.5 to 9.5 before the gates open. Rain threats introduce the possibility of a delayed start or a shortened game, which affects how bookmakers model late-inning scoring. Lineup announcements matter too — if a team rests two of its best hitters on a day game after a night game, the moneyline can shift by 10-15 cents before most bettors have even checked the slate.
The most informative type of movement is reverse line movement, where the line moves against the side receiving the majority of public bets. If 70% of tickets are on the favourite but the line drifts toward the underdog, it typically means professional bettors have placed large wagers on the other side. The bookmaker is adjusting not because of ticket count but because of the dollar volume — and the sharp money is on the dog. Live betting now accounts for roughly half of all handle on mature US markets, and the in-game odds update after every pitch, creating a second layer of movement that pre-match analysis cannot fully capture. 290 million online bets are placed monthly across UK operators alone — and each one contributes to the aggregate market signal.
The broader backdrop matters here too. GGY from high-street bookmakers in the UK fell 7% year-on-year to 549 million pounds in the third quarter of 2025, reflecting a structural shift toward online betting where international sports like MLB are more accessible and odds are more transparent. As more UK betting volume moves online, the lines on American sports are becoming marginally sharper — meaning the window to exploit lazy pricing is narrowing, but has not yet closed.
Ensure you are getting the highest possible value by comparing lines across the top baseball bookmakers available to British punters.
Comparing Bookmaker Margins on MLB Markets
Not all bookmakers price MLB the same way, and the differences matter more than most recreational bettors appreciate. I maintain accounts with three UK-licensed operators and routinely compare their prices on the same game. The divergences are sometimes trivial — a point or two on the decimal — and sometimes striking, particularly on less popular matchups.
UK bookmakers tend to run wider margins on baseball than on football, for a straightforward commercial reason: the volumes are lower, the market expertise is thinner, and the risk tolerance is more conservative. A football match might carry a 2-3% overround on the match-result market. The same operator might price an MLB moneyline with a 5-7% overround, effectively charging you twice as much for the privilege of betting on a sport they are less confident about.
The Gambling Commission itself has noted that bookmakers may take commercial pricing decisions as they see fit, provided they do not discriminate on protected characteristics. Being a profitable baseball bettor is not a protected characteristic — which means if you consistently find and exploit wide margins, the bookmaker is within their rights to limit your account. That reality makes it all the more important to extract maximum value from every bet while your accounts are unrestricted.
My practical approach: check the moneyline prices on at least two operators before committing any stake. If the gap between the best and worst available price exceeds 0.08 on the decimal — say, 2.15 at one bookmaker versus 2.07 at another — that difference is significant enough to affect your bottom line over a full season. Ten seconds of price comparison before each bet is the single highest-return-on-time activity available to any baseball bettor in the UK.
There is also a structural point worth understanding about how UK bookmakers build their MLB odds. Most do not have dedicated baseball trading desks the way they have for football or horse racing. Instead, they rely on automated feeds from US-facing data providers, occasionally adjusted by a generalist trader. That reliance on automation means the prices are usually competent but rarely sharp. When the automated feed gets it wrong — because it has not accounted for a late lineup change or a bullpen usage pattern that a specialist would catch — the mispricing can sit uncorrected for hours. Those are the windows that matter. Spotting them requires knowledge that most football bettors simply do not have, which is precisely why the opportunity exists.
The flip side of this opportunity is that bookmakers learn. If your account consistently beats the closing line — meaning you placed your bet at a price that turned out to be better than the final market price at first pitch — you will attract attention. How long it takes depends on the operator, but the mechanism is universal. This is not a reason to avoid seeking value; it is a reason to be aware that profitable betting has a shelf life at any given bookmaker. Diversifying your accounts and being strategic about which operator you use for which bet is part of the long-term game.
Why do UK bookmakers show MLB odds in decimal by default?
Decimal odds are the standard display format across European and UK betting markets. They show the total return per pound staked, making payout calculations immediate. Most UK operators allow you to switch to fractional or American formats in your account settings, but decimal remains the clearest option for calculating implied probability on baseball lines.
What is a typical bookmaker margin on an MLB moneyline?
UK operators generally run 4-7% overround on MLB moneylines, though it varies by game and operator. High-profile matchups with balanced action tend to carry tighter margins, while midweek games between lesser-known teams may have wider ones. For context, the average US sportsbook holds approximately 10.15% across all its baseball markets, including less efficient prop and parlay bets.
How do I convert American odds to decimal odds?
For a positive American line, divide by 100 and add 1. So +160 becomes 2.60. For a negative American line, divide 100 by the absolute value and add 1. So -140 becomes 1.714. The decimal number then tells you the total return per unit staked.
Why do MLB odds change after the starting pitcher is announced?
The starting pitcher is the most influential single variable in a baseball game. A team’s win probability can shift by 15 percentage points or more depending on which arm takes the mound. When a listed starter is scratched or replaced, bookmakers adjust the moneyline immediately to reflect the new expected outcome. Always confirm both starters before placing your bet.
Escrito por los editores de «».