MLB Home Run Props Betting — Statcast Data and Park Analysis
 Available in US

Home run props are the most exciting bet in baseball and one of the most mispriced. The bookmaker sets a line — usually “to hit a home run: yes or no” with decimal odds for each side — and you decide whether a batter is more or less likely to go deep than the price suggests. On any given night, the average MLB player has roughly a 3-4% chance of hitting a home run per game. That sounds tiny until you realise that Great American Ball Park in Cincinnati has produced roughly 40 more home runs than any other stadium over the past five seasons, carrying a home run park factor of 1.301. The same batter at the same price has a meaningfully different probability depending on where the game is played and who is on the mound. That is the gap home run prop bettors exploit.
I started betting HR props seriously after Statcast data became freely available. Before that, home run betting felt like a coin flip with bad odds. Now, with exit velocity, barrel rate, and launch angle data accessible to anyone with a browser, you can build an informed view on whether a specific batter in a specific matchup at a specific park is being priced correctly. The tools exist. The question is whether you are using them.
Exit Velocity and Barrel Rate as Predictive Tools
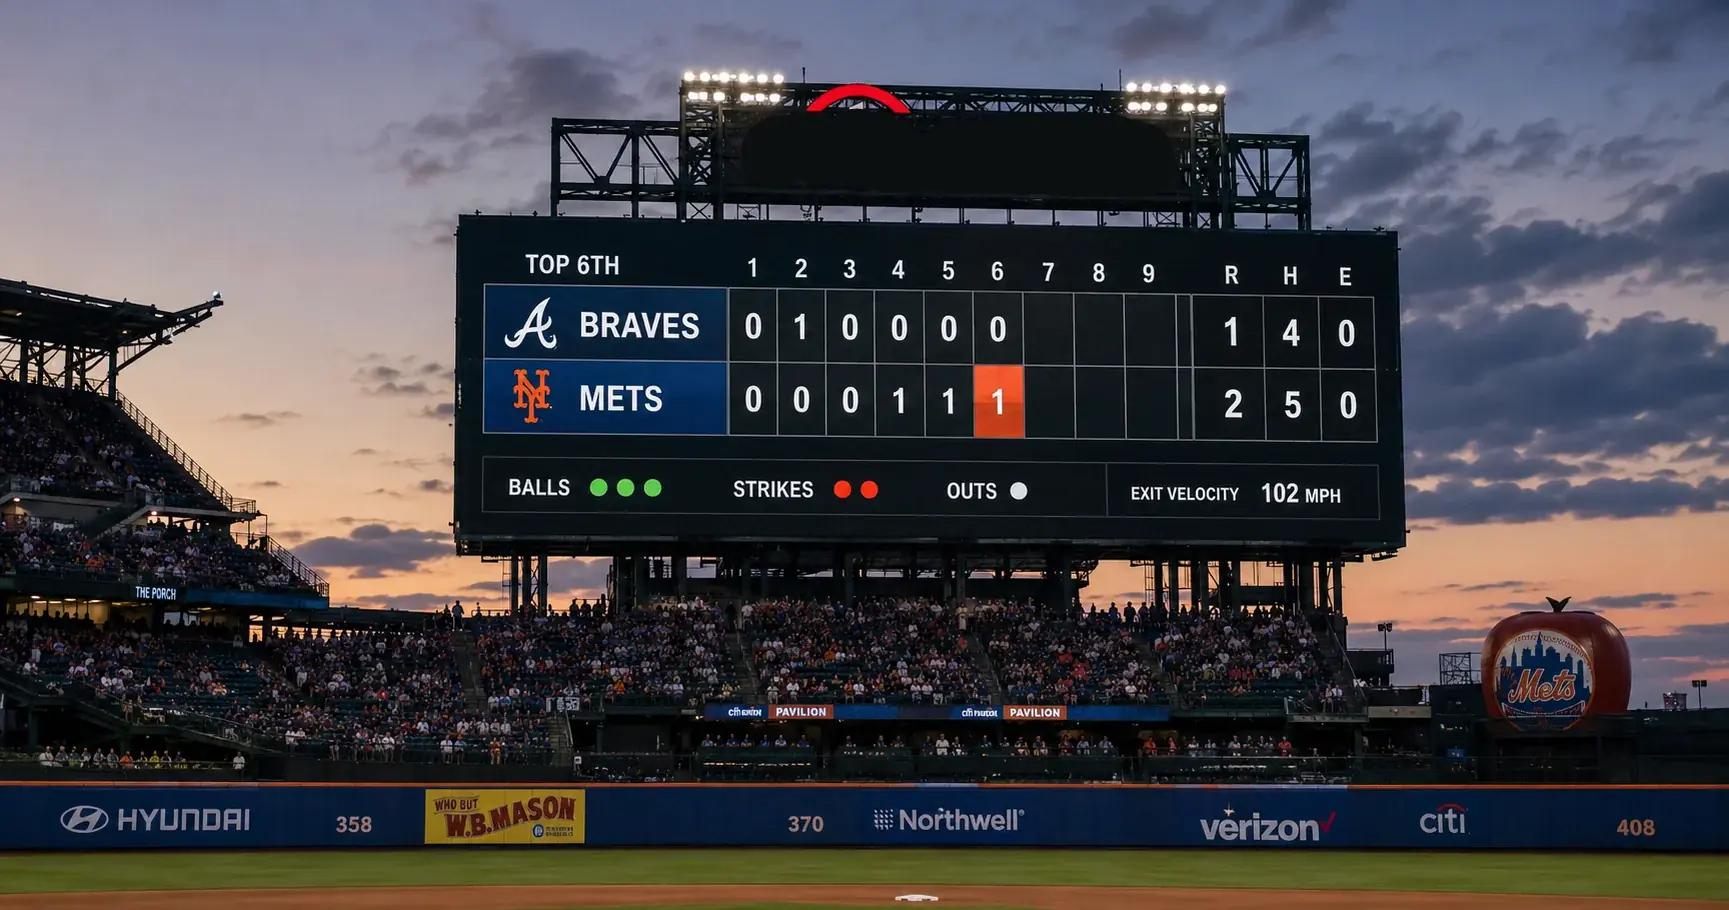
Exit velocity is the speed of the ball leaving the bat, measured in miles per hour. It is the single most predictive Statcast metric for home run power. A batted ball hit at 95 mph has a home run probability in the low single digits. At 100 mph, it jumps. At 105 mph, roughly one in three batted balls that meet the right launch angle leave the park. The relationship is not linear — it is exponential at the top end, which means the difference between a 98 mph average exit velocity and a 102 mph average is larger than the four-number gap suggests.
Barrel rate distils this further. MLB defines a “barrel” as a batted ball with the optimal combination of exit velocity and launch angle to produce a batting average of .500 and a slugging percentage of 1.500. In simpler terms, a barrel is the kind of contact that almost always results in extra-base hits and frequently results in home runs. Elite power hitters barrel the ball on 12-15% of their batted balls. League average sits around 6-7%. When I am evaluating a home run prop, barrel rate over the past thirty days is the first number I check. A batter barrelling the ball at 14% is generating home run opportunities at more than double the rate of one at 6%, regardless of what their box score says.
The predictive power of these metrics is what separates Statcast-based prop analysis from traditional stats. A batter’s home run total over the past two weeks can be misleading — he might have hit three home runs on mishit fly balls that barely cleared the fence, or he might have hit zero despite consistently barrelling the ball because he was playing at pitcher-friendly parks. Exit velocity and barrel rate tell you about the quality of contact, not the result. The results follow the quality, and when the market is still pricing the player based on recent results rather than underlying contact quality, you have an edge.
Matching Batters to Parks for HR Value
Not all home run opportunities are created equal. Oracle Park in San Francisco suppresses home runs for right-handed hitters by approximately 21% relative to the league average, with a right-handed batter home run park factor of 0.765 over recent seasons. A right-handed slugger priced at 4.50 to hit a home run at Oracle might be fairly priced, while the same batter at the same price at Coors Field or Great American Ball Park would be a steal.
BettorEdge analysts have noted that park factors can dramatically influence the value of player props, and nowhere is that influence more direct than with home run lines. The adjustments are not complicated. I maintain a simple three-tier classification for every MLB park: hitter-friendly (Coors, GABP, Yankee Stadium), neutral, and pitcher-friendly (Oracle, Petco, Tropicana). For hitter-friendly parks, I lower my odds threshold — I will bet a home run prop at 4.00 that I would need to see at 4.50 at a neutral venue. For pitcher-friendly parks, I raise it or skip the prop entirely unless the batter’s barrel rate is elite.
The directional matchup matters too. Left-handed pull hitters benefit from parks with short right-field porches. Right-handed pull hitters benefit from short left-field fences. A lefty with elite barrel rates visiting Yankee Stadium, where the right-field porch sits at just 314 feet, is a different proposition from the same batter at Comerica Park, where the left-centre gap stretches to 370 feet. Spray chart data from Baseball Savant shows where each batter tends to hit his hardest-contact balls, and overlaying that spray pattern onto the specific park’s dimensions gives you a sharper picture than any single metric alone.
Pitcher HR Tendency: Fly-Ball Rate and HR/FB
The other side of every home run prop is the pitcher. Some pitchers give up home runs far more frequently than others, and the metrics that predict this tendency are more stable than most bettors realise. The two I track are fly-ball rate and HR/FB — the percentage of fly balls that leave the park.
A pitcher with a fly-ball rate above 38% is generating more balls in the air than the league average, which creates more home run opportunities by sheer volume. Combine a high fly-ball rate with a HR/FB ratio above 13-14%, and you have a pitcher who surrenders home runs at an elevated clip. These numbers are especially useful when a pitcher’s ERA looks clean but his underlying batted ball profile suggests he has been getting away with it. A 3.20 ERA pitcher with a 42% fly-ball rate and a 9% HR/FB is overdue for regression — his home run suppression is unsustainable, and when it cracks, the batter’s prop becomes more valuable.
Conversely, ground-ball pitchers with fly-ball rates below 35% and HR/FB ratios below 10% make poor targets for home run props, regardless of how the batter is swinging. A sinker-baller who induces ground balls on half his pitches is systematically reducing the number of fly balls available to leave the park. Against these pitchers, I typically skip home run props entirely and look for value in hits or total bases markets instead.
The sweet spot for home run prop betting is the intersection of three factors: a batter with elite barrel rates and exit velocity, a park that favours home runs in the batter’s pull direction, and a pitcher with an elevated fly-ball tendency. When all three align, the home run probability exceeds what most bookmaker prices imply, and the prop becomes a bet worth making. Those triple-alignment spots do not appear every night, but across a full MLB season, they appear often enough to sustain a profitable prop strategy.
What exit velocity does a batter need to consistently hit home runs?
Batted balls need to leave the bat at roughly 95 mph or above to have a realistic chance of clearing the fence, but consistent home run power typically requires an average exit velocity of 90 mph or higher across all batted balls. Elite power hitters average 92-95 mph. The relationship between exit velocity and home run probability is exponential at the top end — a few extra mph make a large difference.
Should I bet home run props differently for day games vs night games?
Day games in warm weather tend to produce slightly more home runs because hot air is less dense and the ball carries further. The effect is modest but measurable, particularly at outdoor parks during summer months. Night games in cooler conditions slightly reduce ball flight. Adjust your threshold marginally for extreme temperature differences, but park factor and batter quality remain the dominant variables.