MLB Betting Advanced Stats — wOBA, xFIP, BABIP for Bettors
For the first two years of my MLB betting career, I used the same stats every casual fan uses: batting average, ERA, home runs, RBIs. I won some, lost more, and could never figure out why my analysis kept missing. Then a friend who worked in baseball analytics introduced me to the metrics that front offices actually use to evaluate players — wOBA, xFIP, BABIP, WAR. The learning curve was steep, but the payoff was immediate. I started seeing gaps between what the betting market priced and what the data said, and those gaps turned into edges.
Advanced stats are not some academic exercise. They are the tools that separate informed bettors from the crowd. Baseball generates more measurable data per game than any other major sport, and the advanced metrics distil that data into numbers that predict future performance better than traditional stats. You do not need a maths degree to use them — you need to understand what each one measures, why it matters for betting, and where to find it for free.
wOBA: Weighted On-Base Average for Lineup Strength
The first time I saw wOBA on a FanGraphs page, I thought it was a typo. It looked like OBP with a printing error. But wOBA — Weighted On-Base Average — is arguably the single most useful offensive metric for MLB bettors, because it captures what batting average and OBP miss: not all hits are created equal.
Batting average treats a bloop single and a towering home run as the same event. OBP adds walks but still weights everything equally. wOBA assigns different values to different outcomes based on their actual run-scoring impact. A home run is worth more than a double, which is worth more than a single, which is worth more than a walk. The formula produces a number on a similar scale to OBP — league average sits around .320 — but the information it carries is far richer.
For betting, wOBA tells me how dangerous a lineup actually is, not how its box score looks. A team with a .330 wOBA is producing more runs per plate appearance than a team with a .310 wOBA, even if the second team has a higher batting average. When I model game totals or evaluate moneyline value, I use team wOBA over the previous thirty days as my primary measure of offensive strength. It correlates more tightly with run scoring than any traditional stat, and that correlation is what makes it predictive rather than descriptive.
MLB underdogs win roughly 44% of all games, and a disproportionate share of those upsets involve underdogs whose wOBA is close to or above the favourite’s. When the market sets a moneyline based on team record and starting pitcher reputation, but the underdog’s lineup has been quietly posting a .335 wOBA over the past two weeks, there is often value lurking. The public sees a losing team. The data sees a lineup that hits the ball hard.
xFIP and BABIP: Separating Skill From Luck
A pitcher I was tracking in 2023 had an ERA of 2.80 through his first twelve starts. Beautiful number. I backed his team three times and won twice. Then I checked his xFIP — 4.10. His BABIP against was .240, well below the league average of roughly .300. The numbers were screaming that he had been lucky, not good. Over his next ten starts, his ERA ballooned to 4.50 as the luck regressed. The market, which had priced him as an ace based on the early ERA, was slow to adjust.
xFIP — Expected Fielding Independent Pitching — takes FIP and normalises the home run component. Regular FIP uses the pitcher’s actual home runs allowed; xFIP replaces that with the league-average home run rate per fly ball. The idea is that a pitcher’s actual HR/FB rate bounces around from year to year due to luck and park effects, so replacing it with the average gives a cleaner picture of skill. When a pitcher’s ERA sits far below his xFIP, regression is coming. When ERA sits above xFIP, improvement is likely. That gap is a betting signal — one I check for every starter on my card.
BABIP — Batting Average on Balls In Play — measures how often batted balls that are not home runs fall for hits. League average sits around .300, and while some pitchers sustain a slightly lower BABIP through elite stuff or defensive support, extreme deviations in either direction almost always regress. A pitcher with a .220 BABIP is getting lucky — line drives are finding gloves, ground balls are being fielded cleanly, and the defence is playing above its head. A pitcher with a .340 BABIP is getting unlucky, or his stuff has genuinely declined. The distinction matters enormously for betting: a «bad» pitcher with a .340 BABIP may be about to improve, while a «good» pitcher with a .220 BABIP may be about to fall apart.
I use xFIP and BABIP together as a regression filter. If both suggest a pitcher’s surface stats are unsustainable, I fade him regardless of how his ERA looks. If both suggest he is better than his results, I look for spots to back him at inflated odds. The combination catches mispricings that single-stat analysis misses.
WAR in a Betting Context: When It Helps and When It Doesn’t
WAR — Wins Above Replacement — is the grand unifying stat of baseball analytics. It estimates how many wins a player contributes to his team above what a freely available replacement-level player would provide. A 6.0 WAR season is an MVP candidate. A 2.0 WAR season is a solid regular. Zero or below is replacement level.
For futures betting, WAR is useful. Projecting a team’s total WAR roster helps estimate their season win total, and comparing projected WAR between two teams can inform division winner and pennant futures. Across the 2,430-game MLB season, the accumulation of individual WAR values roughly predicts team performance — not perfectly, but well enough to anchor a futures model.
For individual game betting, WAR is almost useless. It is a cumulative stat that reflects performance over months, not the variables that determine tonight’s moneyline: the starting pitcher, the lineup, the park, the weather. A player’s WAR tells you he has been excellent this season; it does not tell you whether he will get two hits tonight against a left-handed sinker-baller at a pitcher’s park. I never use WAR when evaluating daily game bets. It is a season-level tool applied to a game-level question, and that mismatch produces noise rather than signal.
Free Sources for MLB Advanced Stats
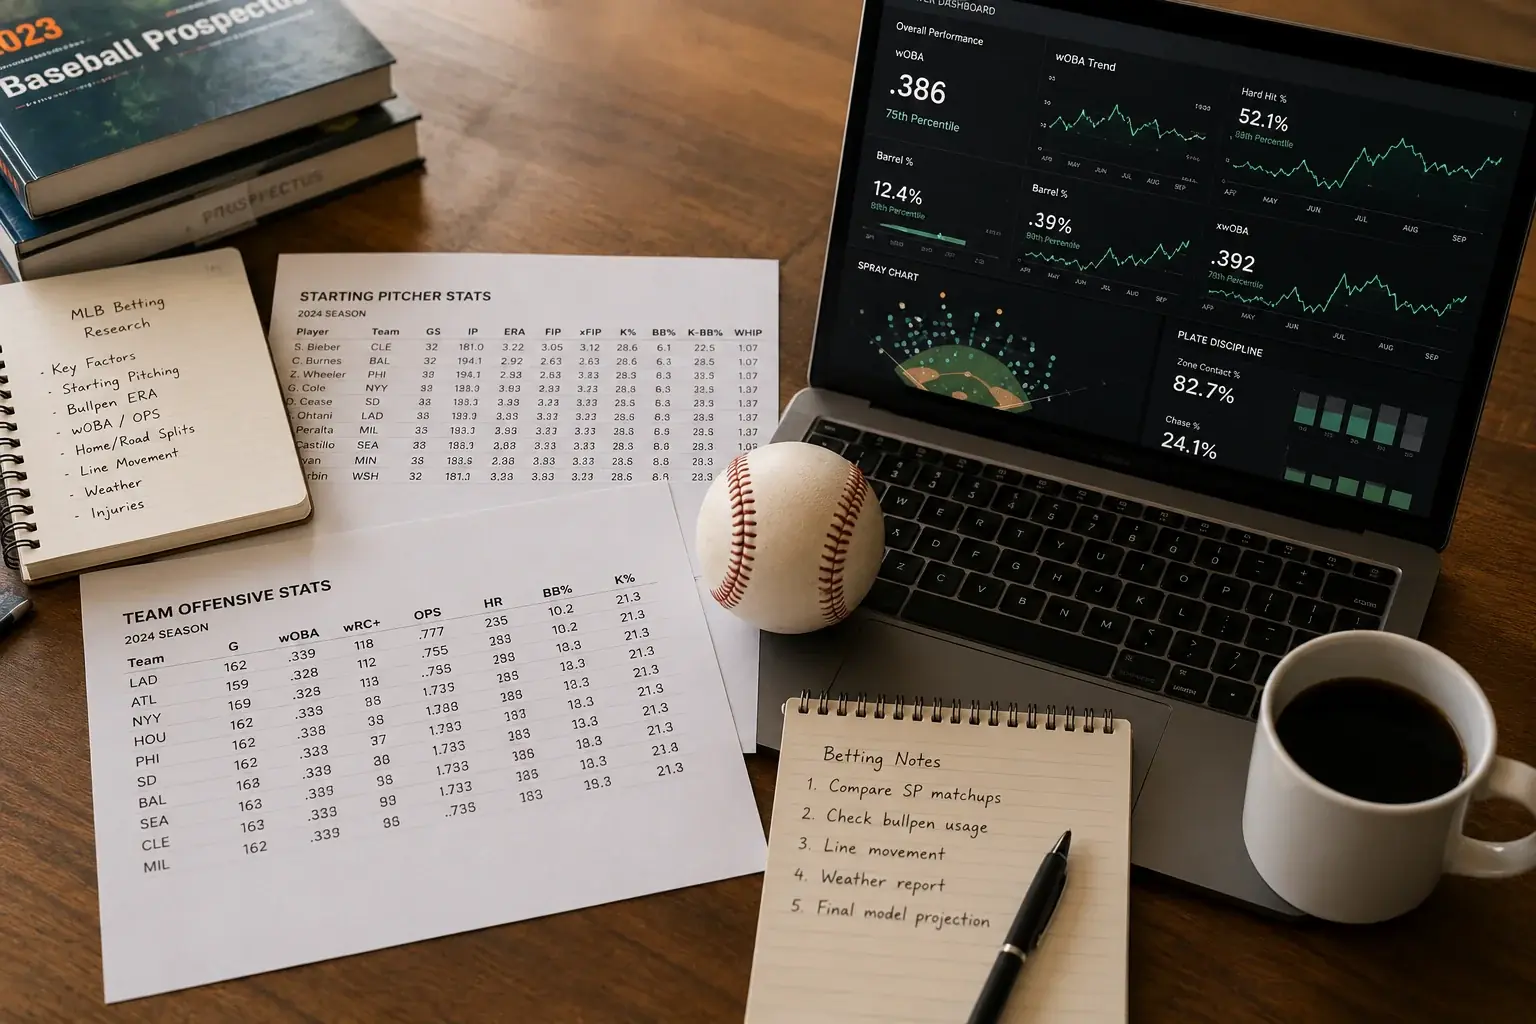
Every metric I have described is available for free. FanGraphs is my primary source — it provides wOBA, xFIP, BABIP, WAR, and dozens of other stats for every MLB player, sortable by date range, splits, and situation. The leaderboard function lets me rank all starting pitchers by xFIP over the last thirty days, or all lineups by team wOBA against right-handed pitching. That kind of granularity is what turns a hunch into a data-backed position.
Baseball Savant, run by MLB itself, offers Statcast data — exit velocity, launch angle, sprint speed, spin rate — that underpins many advanced metrics. If I want to know whether a pitcher’s xFIP improvement is backed by better stuff or just a scoring anomaly, I check his spin rates and pitch movement on Savant. Baseball Reference rounds out the trio with comprehensive historical data, game logs, and head-to-head splits. All three sites are free, updated daily, and structured for exactly the kind of research that profitable MLB betting demands.
The investment is time, not money. Thirty minutes a day with these tools will teach you more about baseball’s underlying mechanics than a year of watching highlights. And the metrics they provide — wOBA for lineups, xFIP and BABIP for pitchers, WAR for season-level context — form the analytical backbone that supports every other piece of your betting process.
Do I need to understand advanced stats to be a profitable MLB bettor?
Not necessarily, but they substantially improve your edge. Traditional stats like ERA and batting average describe what has happened; advanced metrics like xFIP, wOBA, and BABIP predict what is likely to happen next. Bettors who use advanced stats consistently identify mispricings that surface-level analysis misses, particularly in pitcher evaluation and lineup strength assessment.
What is the single most useful advanced stat for baseball betting?
For daily game betting, xFIP is the most actionable single metric. It isolates pitcher skill from luck and defence, stabilises faster than ERA, and directly informs moneyline and totals analysis. For offensive evaluation, wOBA provides the most complete picture of lineup strength. Using both together gives a reliable foundation for game-level betting decisions.
Creado por la redacción de «Best mlb Betting».