MLB Betting Data Sources — Free Tools Every Bettor Should Use
 Available in US
The gap between a recreational MLB bettor and a profitable one is not talent or intuition — it is data. Baseball generates more granular, publicly available statistical information than any other professional sport, and the tools to access that information are free. Every pitch, every swing, every batted ball in every one of the 2,430 regular-season games is tracked, measured, and published for anyone to analyse. The infrastructure that MLB front offices use to evaluate players is, in large part, the same infrastructure available to you from a laptop in London. The only barrier to entry is knowing where to look and what to look for.
I use three primary data sources for my daily MLB betting research: Baseball Savant for Statcast data, FanGraphs for projections and splits, and Baseball Reference for historical records and game logs. Each serves a distinct purpose, and together they cover every analytical angle a bettor needs. There are supplementary tools beyond these three — lineup trackers, weather sites, umpire databases — but the core trio handles ninety percent of the research workload.
Baseball Savant: Statcast and Spray Charts
Baseball Savant is MLB’s official data portal, and it is the single most powerful free tool available to baseball bettors. Statcast cameras installed in every MLB stadium track the physical movement of every pitch and every batted ball, recording exit velocity, launch angle, spin rate, sprint speed, and dozens of other measurements. Savant publishes all of this data in real time, sortable by player, team, date range, and situation.
For daily betting, the features I use most are the pitcher and batter matchup pages. If I want to know how a specific pitcher has performed over his last five starts, Savant shows me his pitch-by-pitch data: average velocity by pitch type, whiff rate, ground-ball rate, and barrel rate against. These are the underlying indicators that traditional stats like ERA obscure. A pitcher whose ERA is 3.00 but whose barrel rate against has spiked over his last three outings is giving up hard contact that has not yet been converted into runs — but will be soon.
Spray charts are the other Savant feature I consult daily. For home run and hits props, knowing where a batter tends to hit the ball — pull side, centre, opposite field — helps me assess whether tonight’s park dimensions favour or hinder his contact profile. A left-handed pull hitter at Yankee Stadium is a different proposition from the same batter at Tropicana Field, and the spray chart data makes that distinction precise rather than speculative.
Savant’s search function is underrated. I can query something like “all batted balls with exit velocity above 100 mph against left-handed pitching at Coors Field in 2025” and get a results table in seconds. That kind of custom query is the foundation of original research — the type of analysis that bookmakers’ lines have not priced in, because most bettors are not asking the question.
FanGraphs: Projections and Splits
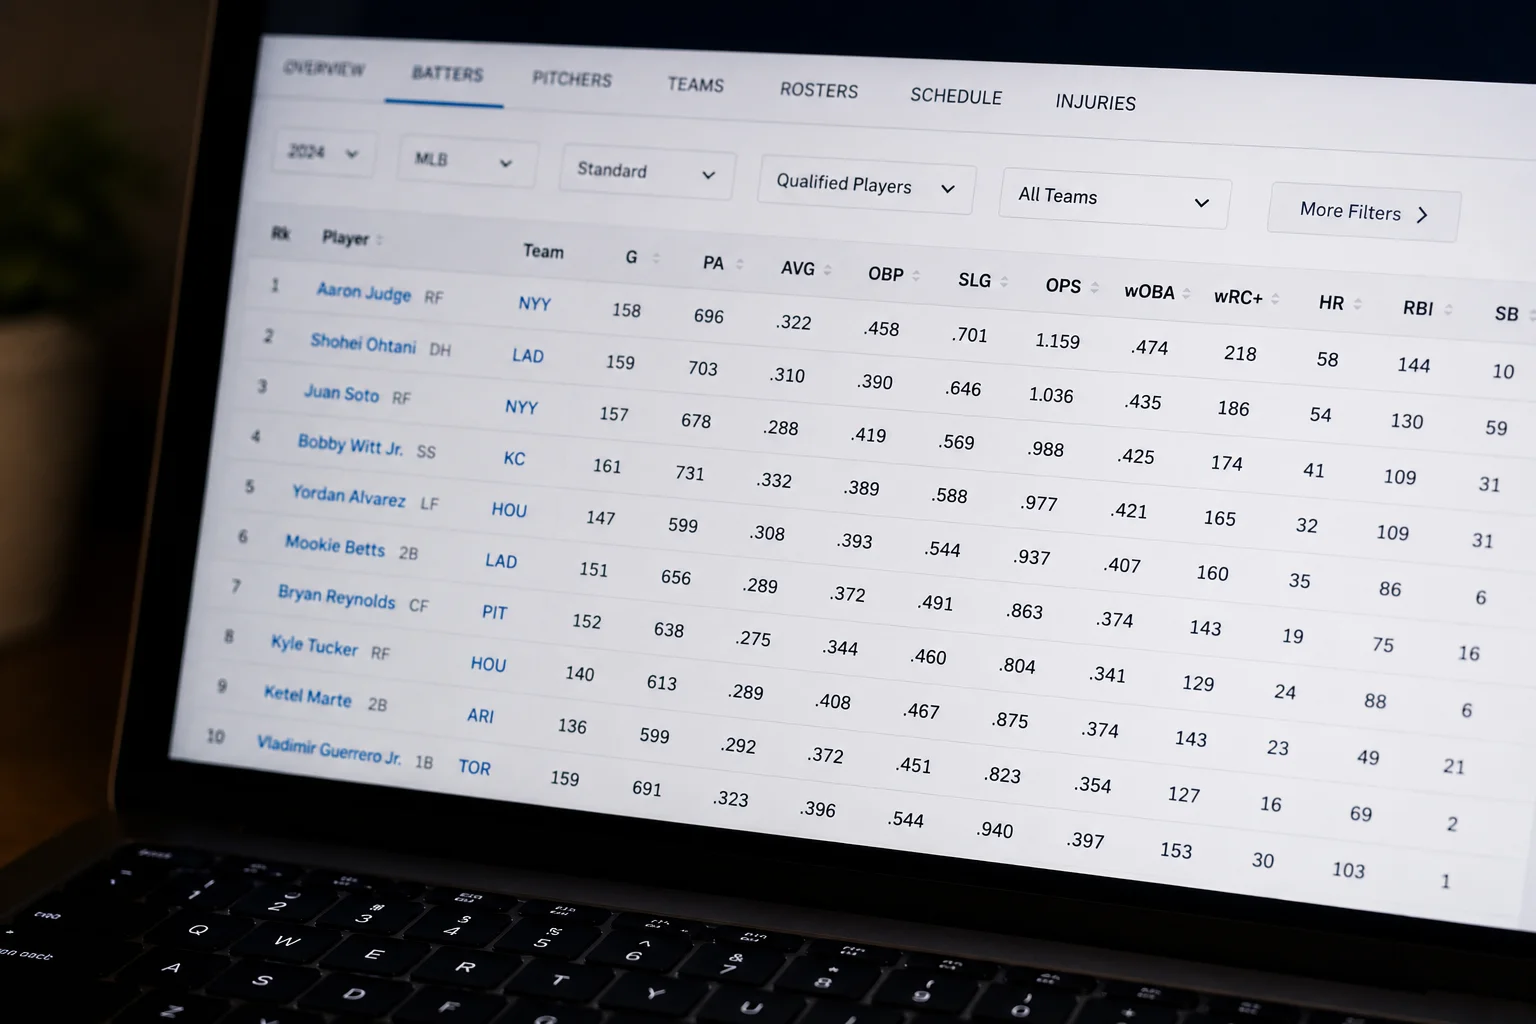
FanGraphs is the analytical complement to Savant’s raw data. Where Savant gives you the physical measurements, FanGraphs translates those measurements into the advanced metrics that drive betting models: wOBA, xFIP, BABIP, WAR, and dozens of others. The site’s leaderboard function is my starting point every morning — I sort pitchers by xFIP over the last fourteen days, check which starters are outperforming or underperforming their surface stats, and flag mismatches between ERA and xFIP as potential betting angles.
Splits are the most directly useful feature for game-level betting. FanGraphs allows you to filter any player’s stats by home/away, vs left-handed/right-handed pitching, day/night, month, and count situation. In 2024, US sportsbooks processed 149.6 billion dollars in legal handle, and the bettors who profit consistently are the ones using splits data to evaluate matchups at a level the general public does not reach. A batter hitting .310 against right-handed pitching and .220 against left-handed pitching is not the same threat in every game, and the moneyline should reflect that asymmetry — but it often does not.
FanGraphs’ projection systems — ZiPS and Steamer — provide preseason and in-season projections for every MLB player. These projections are useful for futures betting and for setting a baseline expectation against which actual performance can be measured. If a pitcher’s ZiPS projection has him at a 3.80 xFIP for the season and he is currently sitting at 3.20 through forty starts, the projection suggests regression is likely. The gap between the projection and reality is an analytical signal, not a guarantee, but it informs my view of where the market might be overpaying for recent performance.
Baseball Reference, Lineups Sites, and Weather Tools
Baseball Reference is the historical archive. If I need a pitcher’s career record against a specific team, his game-by-game logs from last season, or the head-to-head results between two franchises over the past five years, B-Ref has it organised and searchable. The site is less useful for daily betting than Savant or FanGraphs because its strength is historical depth rather than real-time analysis. But for futures research, postseason preparation, and evaluating long-term trends, it is indispensable.
Lineup confirmation sites fill a specific gap in the daily routine. MLB does not announce lineups on a single central platform at a consistent time. Third-party sites aggregate lineup data from team social media accounts and official sources, publishing the confirmed starting nine as soon as it is available. I check these sites during my afternoon research session, and the information directly affects whether I bet a game or skip it. A lineup missing two key hitters changes the run-scoring projection meaningfully.
Weather tools round out the data stack. The hourly forecast for each stadium’s city tells me wind speed, wind direction, temperature at first pitch, and rain probability. These are free data points available from any weather service, and the three-minute check they require has saved me from countless over/under bets that would have been sunk by unexpected wind conditions or rain delays.
Putting the Sources Together
The power of these tools is not in any one source — it is in the combination. A typical pre-game analysis might work like this: I identify a pitching matchup on FanGraphs that shows a starter with a rising xFIP facing a lineup with strong wOBA splits against his pitch type. I cross-check on Savant to see whether the starter’s underlying stuff has genuinely declined or if the xFIP jump is driven by a small sample of unlucky batted balls. I check Baseball Reference for the starter’s historical record at tonight’s park. I confirm the lineup and note any missing regulars. I check the weather and the umpire.
The whole process takes fifteen to twenty minutes per game and produces a level of analysis that the vast majority of bettors — particularly UK bettors on a niche American sport — never reach. The data is free. The tools are free. The only investment is your time and the willingness to learn what the numbers mean. If you are betting MLB without using these sources, you are bringing an opinion to a data fight. The data wins.
Is Baseball Savant data free to access?
Yes. Baseball Savant is maintained by MLB and provides full Statcast data at no cost. You can search by player, team, date range, and dozens of other filters without creating an account. The site is updated in real time during the season, with pitch-level and batted-ball data available within minutes of each game ending.
Which site is best for MLB pitcher-vs-batter splits?
FanGraphs is the best source for detailed splits data, allowing you to filter a player’s stats by opponent handedness, home/away, day/night, and monthly periods. For specific head-to-head matchup data between an individual pitcher and batter, Baseball Reference provides historical at-bat results including batting average, strikeouts, and home runs in the matchup.